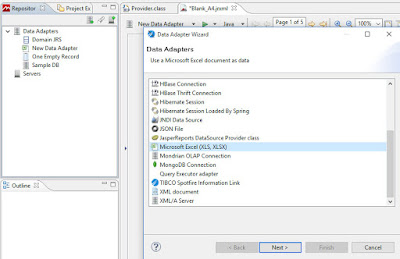
1. Click on the database icon
2. Select XLS, XLSX format
3. Next
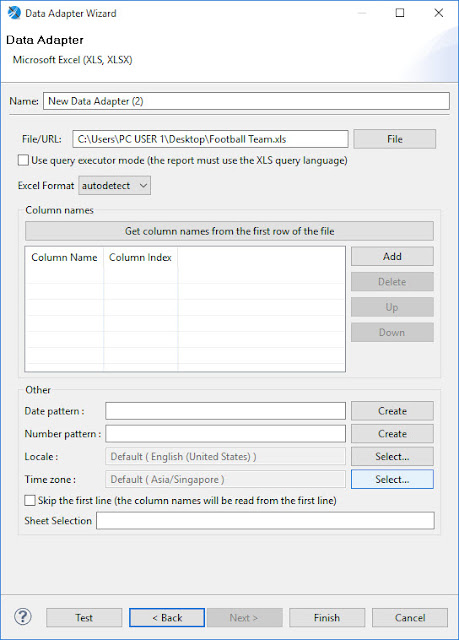
4. Choose file from computer (Desktop/laptop)
5. Click Test if the file data is good for the jaspersoft
6. Then click "Get column names from the first row of the file"
Unable to get value for Excel field "Score" of class java.lang.String.
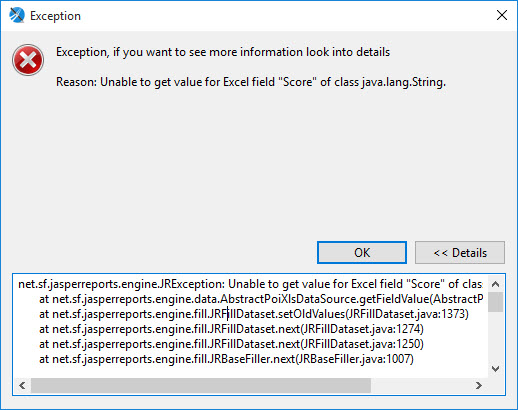
The solution to this is:
Since the column field are in the form of value (numbers/integers) the class type must be = java.length.short. If the column field is in the form of text then class type = java.length.string
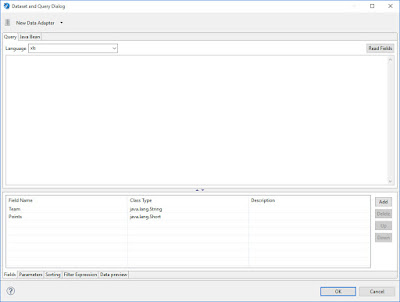
When the data is preview it shows correctly without errors

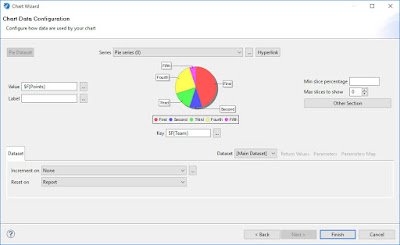
Chart settings where
Series = Team (label name)
Value = Points
Key = Team (Column value name)
Once done - click finish (remember the chart will not automatically updated until "preview" is clicked)
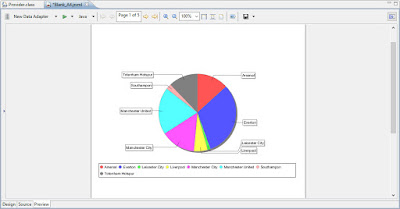
Click preview and this is the output
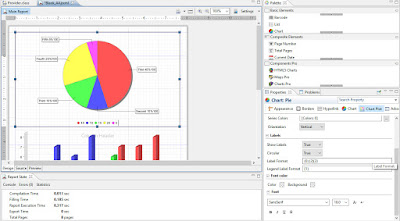
Make the pie chart to show value in numbers, label name value, or percentage using the following command in the chart setting
{0} or null = Series value name
{1} = numbers or the value itself
{2} = Percentage
No comments:
Post a Comment